Key Figures
125
R&D spend in CHF m
18.8
Innovation Rate in %
>2 400
Patents at year-end
3 915
Sales in CHF m
643
EBITDA in CHF m
16.4
EBITDA margin in %
10 281
Staff in FTEs at year-end
34
Employee Net Promotor Score (eNPS)
99.8
Relevant employees who received anti-corruption training in %
0.13
DART rate (Days Away from Work, Restricted, or Transferred)
25
Female representation in top management in %
0.43
Scope 1 & 2 GHG emissions market-based in m t CO2e
(excluding biogenic CO2 emissions)
3.73
Scope 3 GHG emissions (Cat. 3.1 & 3.12) in m t CO2e
7.2
Hazardous waste in kg/t production
1.86
Water intake (without »pass-through« water)
in m3/t production
1.42
Wastewater in m3/t production
The Chairman and CEO's Review
Ben van Beurden (right)
Chairman of the Board of DirectorsConrad Keijzer (left)
Chief Executive Officer
Q&A with the CFO
Oliver Rittgen, Chief Financial Officier
Questions to the Business Presidents
Christian Vang (left)
Care Chemicals and AmericasJens Cuntze (middle)
Catalysts and APACAngela Cackovich (right)
Adsorbents & Additives and EMEA
Questions to the Business Presidents
Christian Vang (left)
Care Chemicals and AmericasJens Cuntze (middle)
Catalysts and APACAngela Cackovich (right)
Adsorbents & Additives and EMEA
Innovation
Innovation
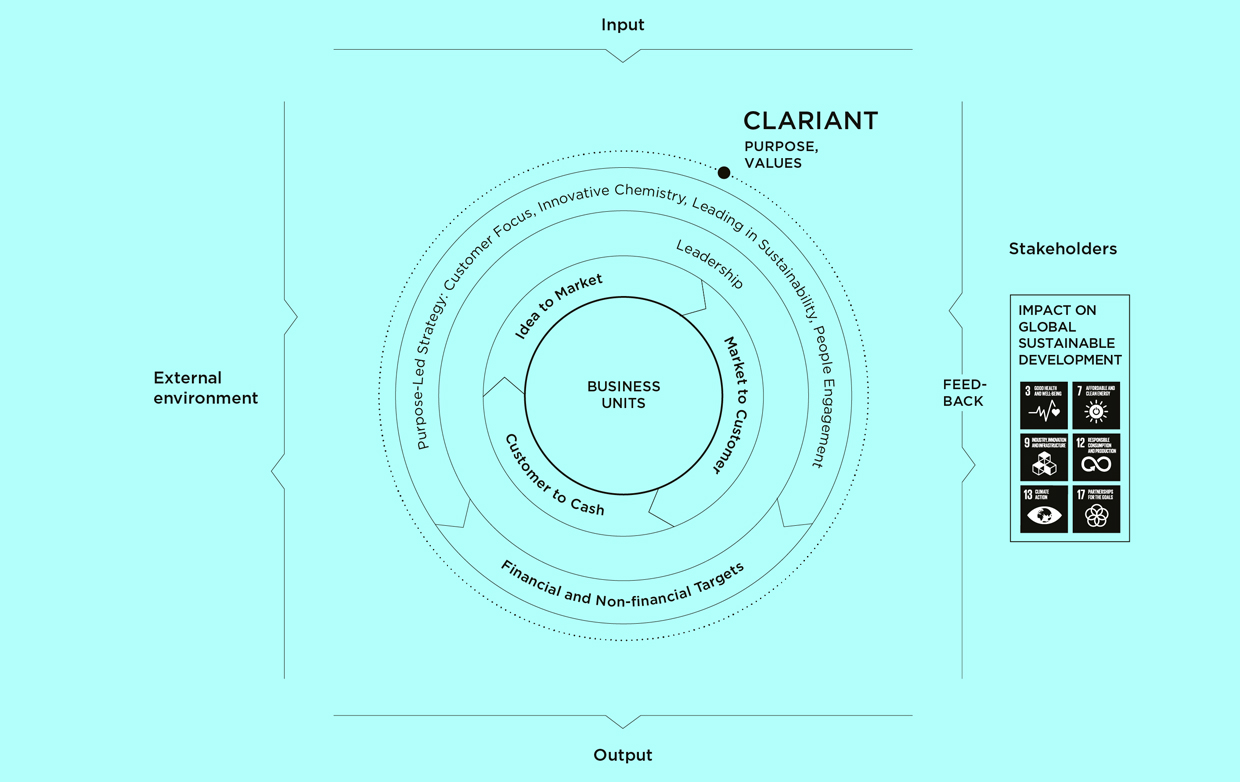
Our Business Model
Clariant’s business model reflects how the company creates longterm value for all stakeholders – customers, employees, shareholders, and the environment. It offers a detailed overview of the company’s multidimensional approach to value creation, covering both tangible and intangible, financial and non-financial aspects of the business.