Key Figures
160
R&D spend in CHF m
>3.5
Growth through innovation in %
>3 600
Patents at year-end
4 377
Sales in CHF m
607
EBITDA in CHF m
13.9
EBITDA margin in %
10 481
Staff in FTEs at year-end
1 004
New employees hired
>660
Staff in Research & Development in FTEs
0.18
Lost-Time Accident Rate (LTAR)
90
Customers who plan to intensify the business relationship in %
12.2
Training hours (Ø per participant)
0.54
Scope 1 & 2 GHG emissions market-based in m t CO2e
(excluding biogenic CO2 emissions)
2.28
Scope 3 GHG emissions for purchased goods and services (cat. 1) in m t CO2e
6.8
Hazardous waste in kg/t production
1.95
Water intake (without »pass-through« water)
in m3/t production
1.48
Wastewater in m3/t production
630
Energy consumption in kWh/t production
Sustainability Shift – Episode 2:
Portfolio Sustainability Assessments
Sustainability Shift – Episode 2:
Portfolio Sustainability Assessments
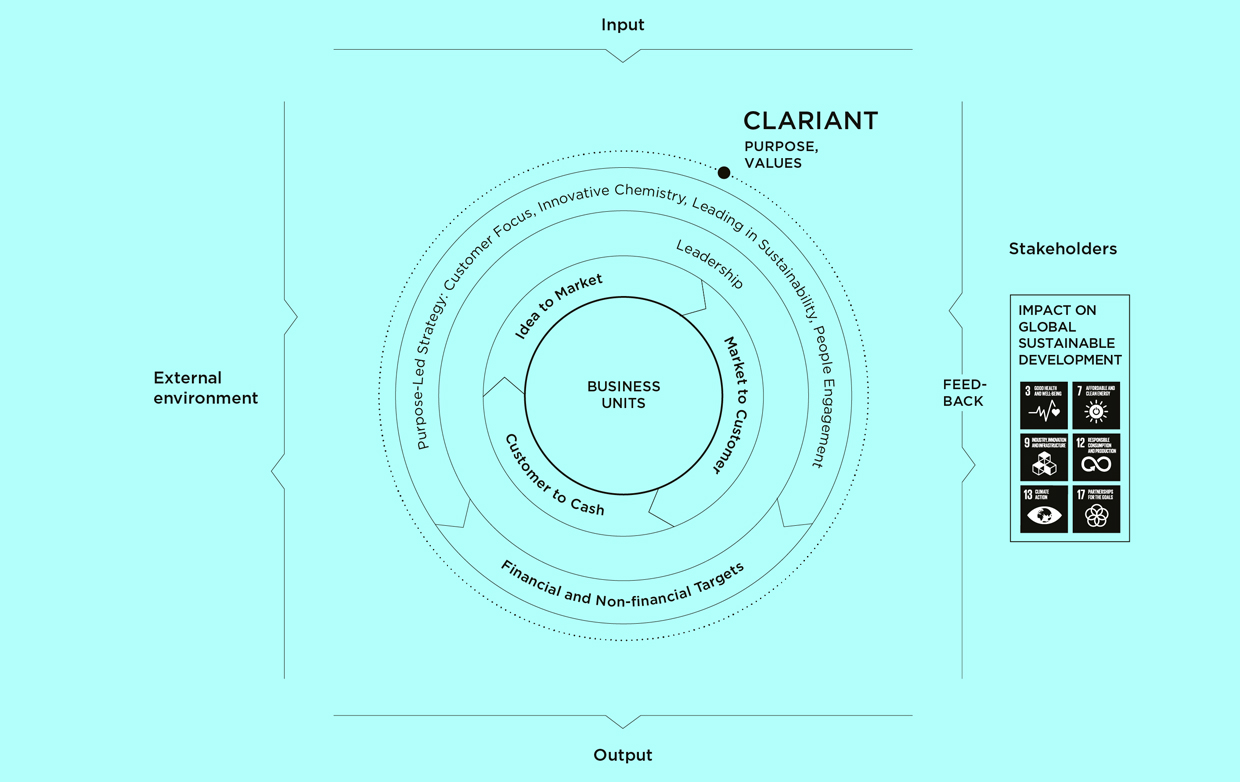
Our Business Model
Clariant’s business model reflects how the company creates longterm value for all stakeholders – customers, employees, shareholders, and the environment. It offers a detailed overview of the company’s multidimensional approach to value creation, covering both tangible and intangible, financial and non-financial aspects of the business.